

Our Data Analysis services are tailored to meet the unique needs of businesses and individuals looking to establish a strong online presence. Our team of skilled professionals combines creativity with technical expertise to create visually appealing, user-friendly, and responsive websites that not only look great but also perform exceptionally well. Whether you need a brand-new website from scratch, a redesign of your existing site, or custom web application development, we have the knowledge and experience to deliver solutions that align with your goals. From front-end design to back-end development, we strive to provide a seamless user experience, optimized for search engines, and equipped with the latest web technologies. Let us help you transform your online vision into a reality with our top-notch Data Analysis services.

Python is commonly used for developing websites and software, task automation, data analysis, and data visualisation. Since it's relatively easy to learn, Python has been adopted by many non-programmers, such as accountants and scientists, for a variety of everyday tasks.
Microsoft Excel is a program in the Office 365 suite typically used to store, sort, and manipulate data. Although Excel is not a database, it is often used in data analytics and finance careers to assess large amounts of information and create visualizations.
Power BI is a collection of software services, apps, and connectors that work together to turn your unrelated sources of data into coherent, visually immersive, and interactive insights.

It helps users create different charts, graphs, maps, dashboards, and stories for visualizing and analyzing data, to help in making business decisions.
Power BI is a collection of software services, apps, and connectors that work together to turn your unrelated sources of data into coherent, visually immersive, and interactive insights.
It helps users create different charts, graphs, maps, dashboards, and stories for visualizing and analyzing data, to help in making business decisions.
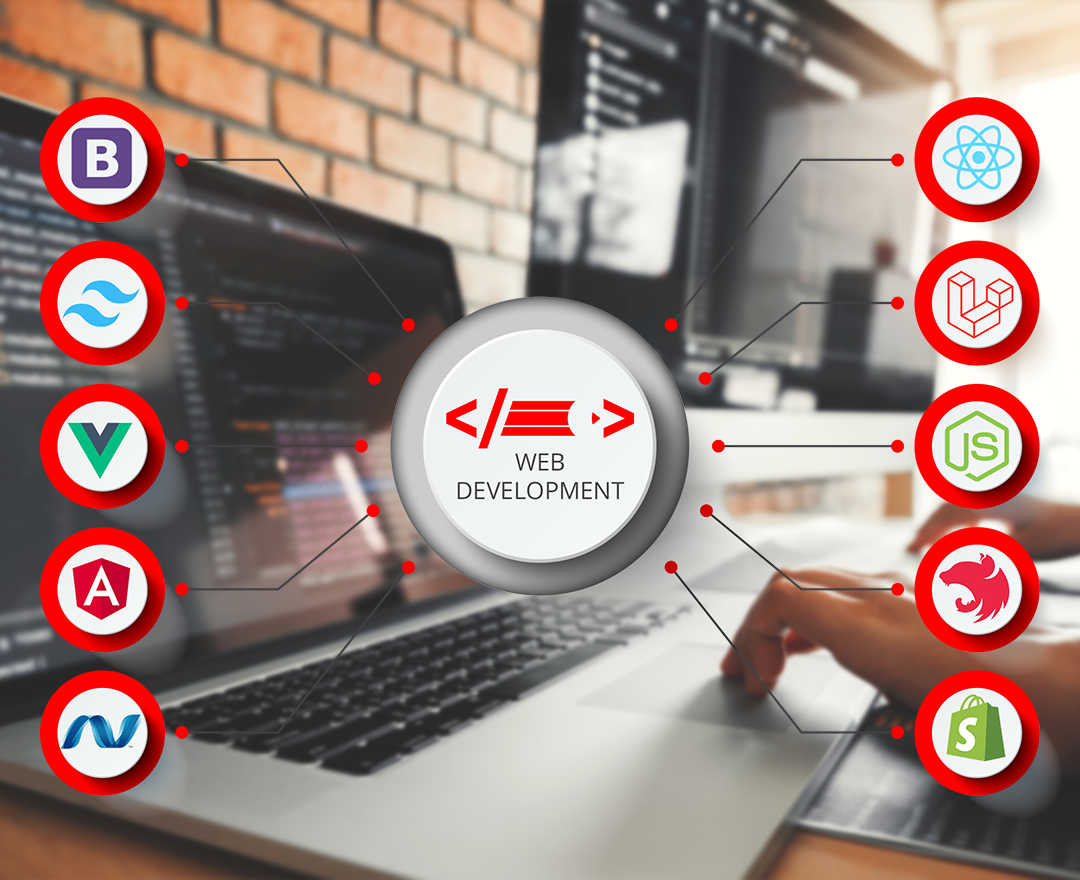
Web development refer to the process of creating a website, from the initial concept to the final product.
Read More
Data analytics involves the use of statistical and computational methods to extract meaning from raw data.
Read More
(SMM) refers to the use of social media platforms such as Facebook, Twitter, Instagram, LinkedIn, and other.
Read More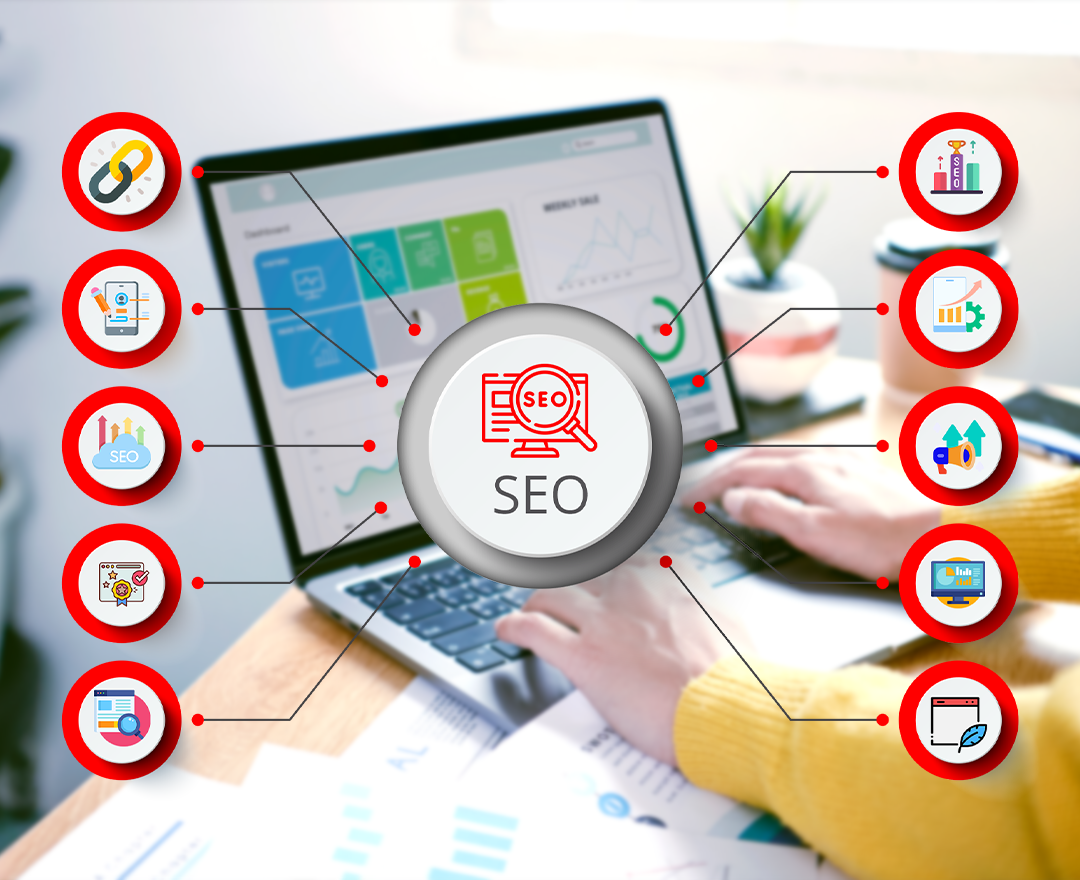
SEO services enhance online visibility through various practices and techniques.
Read More
Mobile app development is the creation of software applications for mobile devices.
Read More
Graphic design visually communicates ideas and information through design elements.
Read More Eng
Eng
 简体中文
简体中文
 العربيّة